JameedLabs Non-Invasive Glucose Monitoring Platform
Comprehensive App User Manual & Clinical Researcher Walkthrough Guide
Welcome to the JameedLabs User Manual. This document is a comprehensive, step-by-step guide designed to walk clinical researchers through the entire operational lifecycle of the JameedLabs desktop software.
Whether you are preparing a patient for a breath acetone sweep, running calibration diagnostics, or managing historical clinical datasets, this guide provides complete, screen-by-screen instructions aligned directly with our active screenshot archive.
🛑 Clinical Best Practices & Compliance Guidelines
Before operating the JameedLabs workstation, all research staff must align with the following clinical data security and instrumentation protocols:
[!WARNING]
🔒 Patient Anonymization & Data Security (HIPAA/GDPR)
DO NOT enter patient names, social security numbers, medical record numbers, or any personally identifiable information (PII) into the JameedLabs application. * ID-Only Standard: Use unique, randomized alphanumeric Subject IDs (e.g.,
SUBJ_2026_042) in the text entry and annotation fields. * Index Segregation: Maintain the Master Identification Index (which maps real names to Subject IDs) in a secure, encrypted secondary system or a locked physical cabinet.[!IMPORTANT]
🧪 Moisture & Condensation Management
Exhaled human breath has nearly 100% relative humidity. Successive back-to-back testing without chamber purging will cause moisture to condense on the Silicon Carbide (SiC) optical window, resulting in baseline drift and inaccurate absorbance calculations. * Active Purging: Always toggle the Chamber Fan to
ONfor 15–20 seconds between patient trials to dry the optical pathway. * Equilibrium Delay: Allow the chamber temperature to stabilize between $28^\circ\text{C}$ and $32^\circ\text{C}$ before zeroing.[!TIP]
📁 Structured Record Management
Avoid accumulating all patient records under a single unstructured history list. * Use the New Folder feature in the History tab to segment trials by cohort (e.g., "Active Cohort A", "Control Group Phase 1") or specific trial dates. * This organization prevents operational errors during bulk CSV exports or ZIP backups.
Chapter 1: Setup and Installation
Before we start testing patients, we need to set up the computer. This section shows how to install the app on your computer.
Let's begin by looking at how to navigate to github releases. Open web browser and navigate to the JameedLabs GitHub repository releases page to find the latest version.
This step is very important. By doing 'navigate to github releases' carefully, you prevent mistakes that could ruin the test results. The app will show you right away if it worked.
 Fig. 1 - Navigate to GitHub Releases
Let's begin by looking at how to latest release - download button. The latest release is displayed prominently. The .exe installer file is listed in the Assets section with a download button.
Why do we do this? In a medical lab, mistakes can cause big problems. The app makes 'latest release - download button' simple so you can focus on the patient instead of the computer.
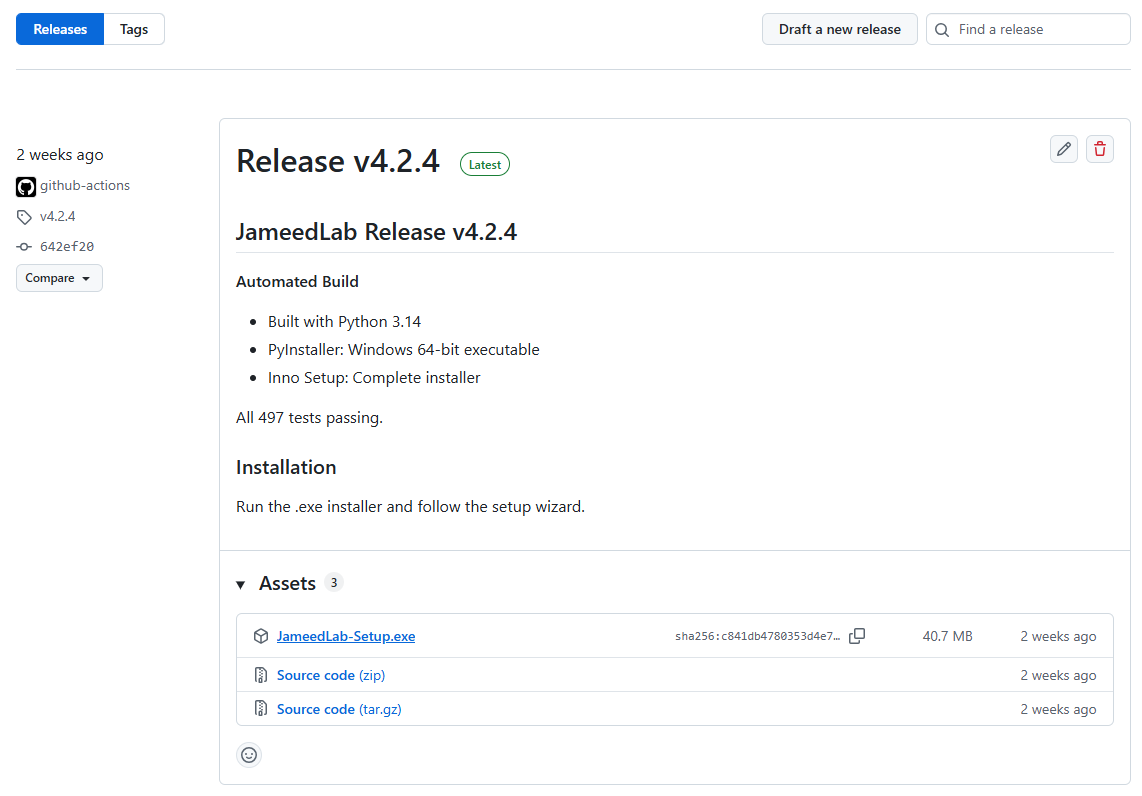 Fig. 2 - Latest Release - Download Button
Let's begin by looking at how to click download installer. User clicks the download button to download the .exe installer file to the Downloads folder.
 Fig. 3 - Click Download Installer
Let's begin by looking at how to open downloads folder. Navigate to the Windows Downloads folder to verify the installer was downloaded successfully.
This step is very important. By doing 'open downloads folder' carefully, you prevent mistakes that could ruin the test results. The app will show you right away if it worked.
 Fig. 4 - Open Downloads Folder
Let's begin by looking at how to installer file - ready to run. The downloaded .exe installer file is visible and ready to execute. Shows file icon and name clearly.
Why do we do this? In a medical lab, mistakes can cause big problems. The app makes 'installer file - ready to run' simple so you can focus on the patient instead of the computer.
 Fig. 5 - Installer File - Ready to Run
Let's begin by looking at how to double-click installer to run. User double-clicks the .exe installer file to launch the installation wizard.
 Fig. 6 - Double-Click Installer to Run
Let's begin by looking at how to windows smartscreen warning. Windows SmartScreen protection may show a warning because the app is unsigned. Dialog shows 'More info' and 'Run anyway' buttons.
This step is very important. By doing 'windows smartscreen warning' carefully, you prevent mistakes that could ruin the test results. The app will show you right away if it worked.
 Fig. 7 - Windows SmartScreen Warning
Let's begin by looking at how to smartscreen - more info (optional). If user clicks 'More info', expanded details are shown about the app publisher and file details.
Why do we do this? In a medical lab, mistakes can cause big problems. The app makes 'smartscreen - more info (optional)' simple so you can focus on the patient instead of the computer.
 Fig. 8 - SmartScreen - More Info (Optional)
Let's begin by looking at how to click run anyway. User clicks the 'Run anyway' button to proceed with running the installer despite SmartScreen warning.
 Fig. 9 - Click Run Anyway
Let's begin by looking at how to user account control (uac) prompt. Windows displays UAC permission dialog asking for administrator approval to run the installer. Shows app icon and confirmation button.
This step is very important. By doing 'user account control (uac) prompt' carefully, you prevent mistakes that could ruin the test results. The app will show you right away if it worked.
 Fig. 10 - User Account Control (UAC) Prompt
Let's begin by looking at how to click yes to allow installation. User clicks Yes in the UAC dialog to grant administrator permissions for the installation.
Why do we do this? In a medical lab, mistakes can cause big problems. The app makes 'click yes to allow installation' simple so you can focus on the patient instead of the computer.
 Fig. 11 - Click Yes to Allow Installation
Let's begin by looking at how to installer welcome screen. The installation wizard opens showing welcome screen with JameedLabs branding, version number, and brief description of what will be installed.
 Fig. 12 - Installer Welcome Screen
Let's begin by looking at how to installation location - default path. Installer shows installation location selection screen. Default path (typically C:\Program Files\JameedLabs) is already selected and recommended.
This step is very important. By doing 'installation location - default path' carefully, you prevent mistakes that could ruin the test results. The app will show you right away if it worked.
 Fig. 13 - Installation Location - Default Path
Let's begin by looking at how to click next - accept default location. User clicks Next to accept the default installation location without changing it.
Why do we do this? In a medical lab, mistakes can cause big problems. The app makes 'click next - accept default location' simple so you can focus on the patient instead of the computer.
 Fig. 14 - Click Next - Accept Default Location
Let's begin by looking at how to desktop shortcut option. Installer asks if user wants a desktop shortcut created for easy application launch. Checkbox option visible with Yes/No or checked/unchecked state.
 Fig. 15 - Desktop Shortcut Option
Let's begin by looking at how to click next - accept shortcut. User clicks Next to proceed with creating the desktop shortcut (or skip if unchecked).
This step is very important. By doing 'click next - accept shortcut' carefully, you prevent mistakes that could ruin the test results. The app will show you right away if it worked.
 Fig. 16 - Click Next - Accept Shortcut
Let's begin by looking at how to installation progress. Installer shows progress bar as files are copied and application components are installed. Progress increases from 0% to 100%.
Why do we do this? In a medical lab, mistakes can cause big problems. The app makes 'installation progress' simple so you can focus on the patient instead of the computer.
 Fig. 17 - Installation Progress
Let's begin by looking at how to installation complete. Installation finishes successfully. Completion screen shown with checkmark or success indicator, option to launch app or close.
 Fig. 18 - Installation Complete
Let's begin by looking at how to click finish - close installer. User clicks Finish button to close the installer. Application may automatically launch if 'Launch app' option was checked.
This step is very important. By doing 'click finish - close installer' carefully, you prevent mistakes that could ruin the test results. The app will show you right away if it worked.
 Fig. 19 - Click Finish - Close Installer
Let's begin by looking at how to desktop shortcut created. After installation, a desktop shortcut for JameedLabs is visible on the Windows desktop. Shows app icon and name.
Why do we do this? In a medical lab, mistakes can cause big problems. The app makes 'desktop shortcut created' simple so you can focus on the patient instead of the computer.
 Fig. 20 - Desktop Shortcut Created
Chapter 2: Opening the App
Now that the app is installed, you can open it. This is where you will do all your work.
To keep the data safe before moving forward, you should launch via desktop shortcut. User double-clicks the desktop shortcut to launch the JameedLabs application.
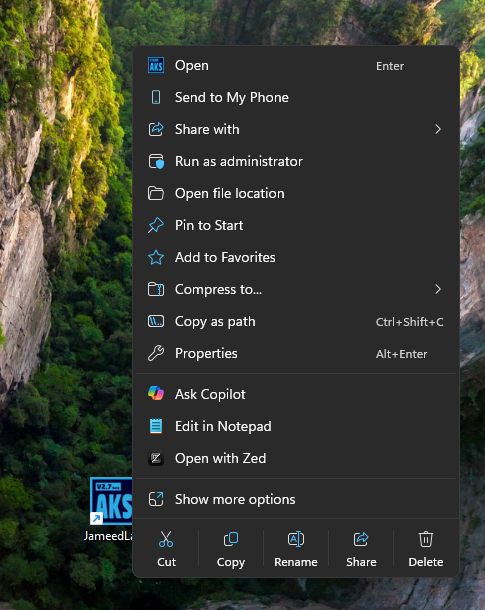 Fig. 21 - Launch via Desktop Shortcut
Once this is done, you can move on to alternative: launch via windows search. User can also launch the app by pressing Windows key, typing 'JameedLabs', and pressing Enter from Windows Start menu search.
This step is very important. By doing 'alternative: launch via windows search' carefully, you prevent mistakes that could ruin the test results. The app will show you right away if it worked.
 Fig. 22 - Alternative: Launch via Windows Search
After finishing that, the next step is to application splash screen. As the application launches, a splash screen appears showing JameedLabs logo, version, and loading indicator. Brief loading state before main window opens.
Why do we do this? In a medical lab, mistakes can cause big problems. The app makes 'application splash screen' simple so you can focus on the patient instead of the computer.
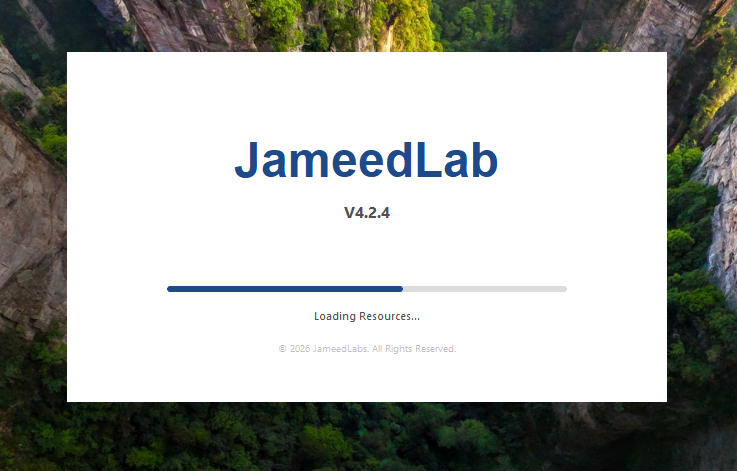 Fig. 23 - Application Splash Screen
To make sure everything is correct, the system asks you to application window - fully loaded. Application fully loads and main window opens. Overview tab is active, showing the default UI state with no device connected.
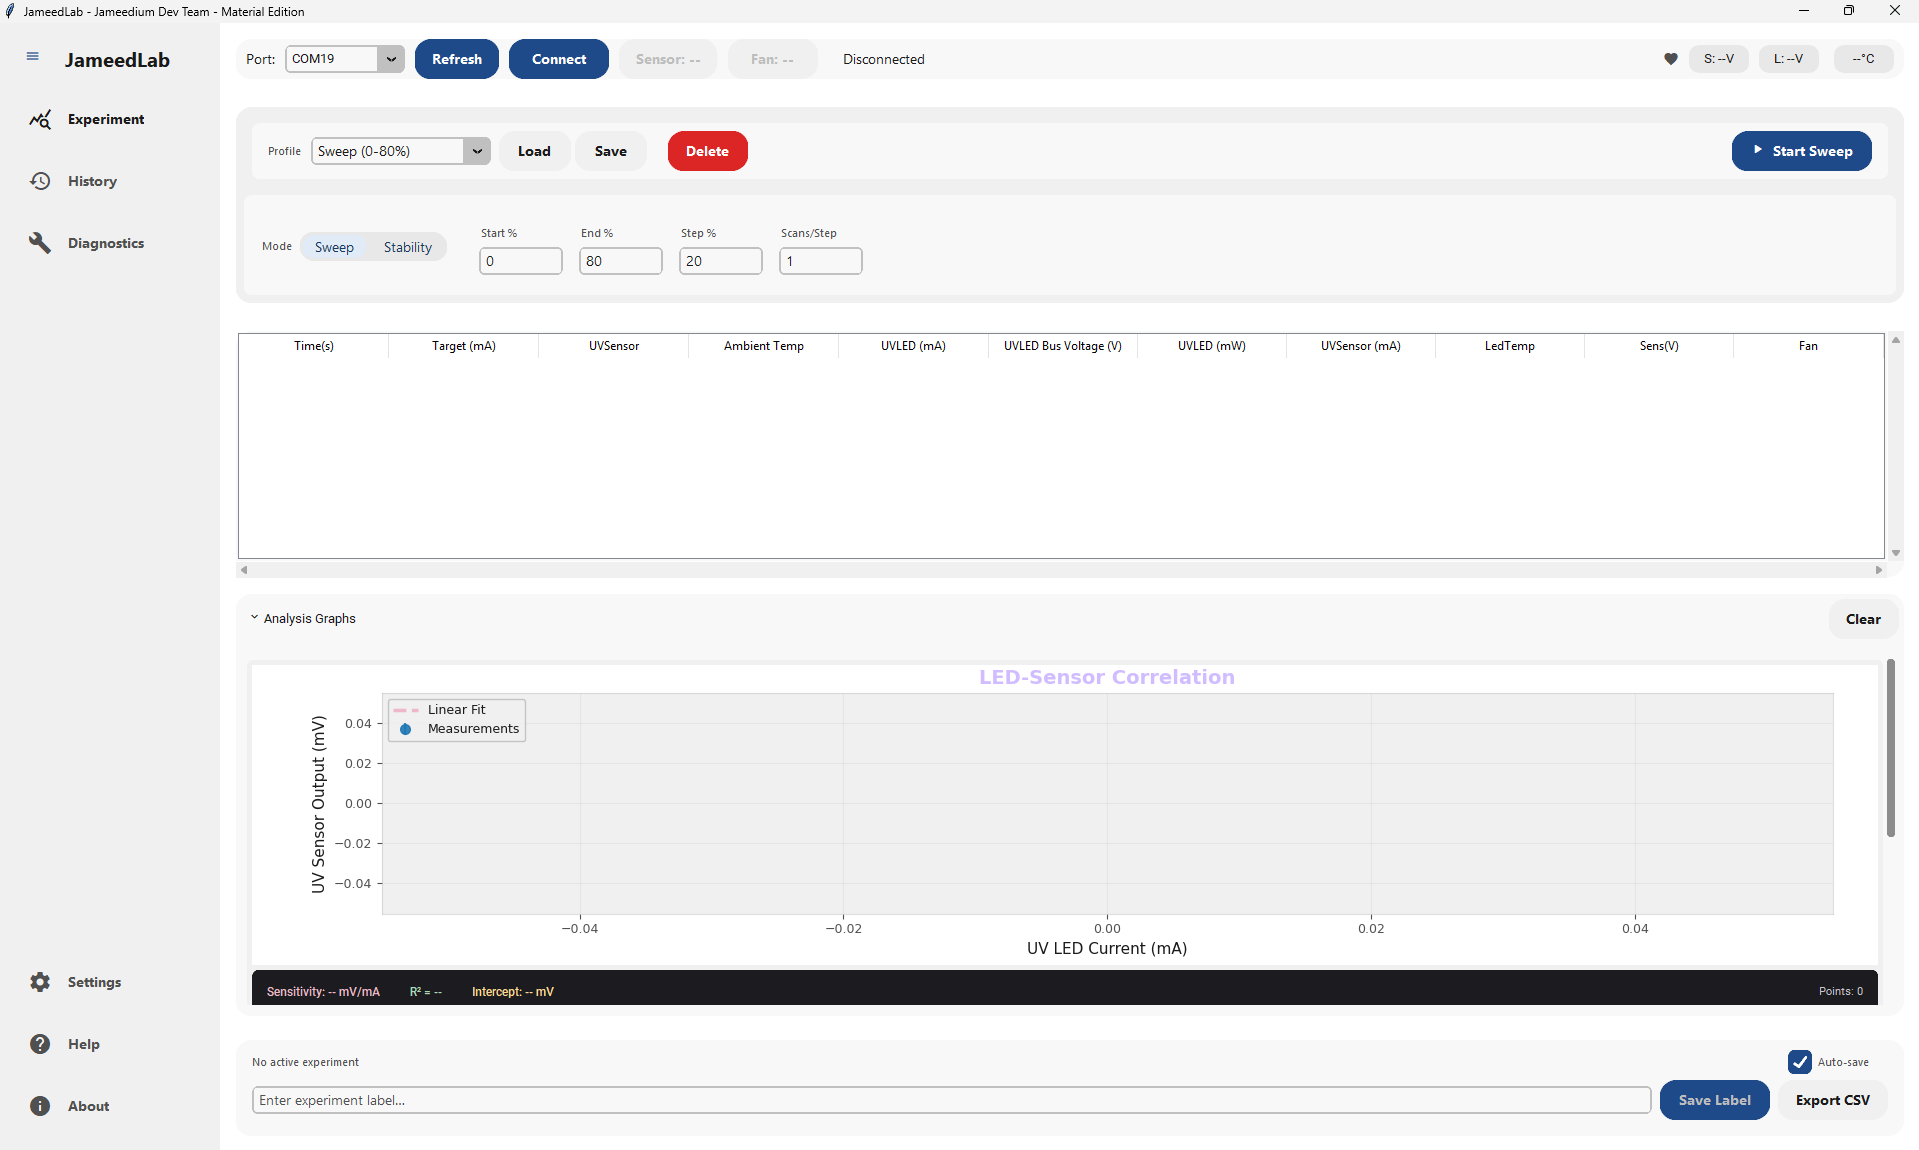 Fig. 24 - Application Window - Fully Loaded
Now it's time to app launch - initial state. Application opens for the first time. The Overview tab is active by default. No device is connected yet.
This step is very important. By doing 'app launch - initial state' carefully, you prevent mistakes that could ruin the test results. The app will show you right away if it worked.
 Fig. 25 - App Launch - Initial State
Following the normal steps, we now function bar - disconnected state. The function bar at the top displays all available controls. Port dropdown is empty or shows 'Scanning...'. Refresh button is ready to click to discover serial ports.
Why do we do this? In a medical lab, mistakes can cause big problems. The app makes 'function bar - disconnected state' simple so you can focus on the patient instead of the computer.
 Fig. 26 - Function Bar - Disconnected State
As part of the process, you will need to click refresh ports button. User clicks the Refresh button to scan for available serial ports. The system searches for connected devices.
 Fig. 27 - Click Refresh Ports Button
To keep the data safe before moving forward, you should ports list populated. After refresh completes, the port dropdown is populated with available ports. MOCK_PORT appears in the list when running in mock mode.
This step is very important. By doing 'ports list populated' carefully, you prevent mistakes that could ruin the test results. The app will show you right away if it worked.
 Fig. 28 - Ports List Populated
Once this is done, you can move on to port dropdown - view all options. User clicks the port dropdown to see all available ports. The dropdown expands showing complete list.
Why do we do this? In a medical lab, mistakes can cause big problems. The app makes 'port dropdown - view all options' simple so you can focus on the patient instead of the computer.
 Fig. 29 - Port Dropdown - View All Options
After finishing that, the next step is to select port from dropdown. User selects a port from the dropdown list. This port will be used for device communication.
 Fig. 30 - Select Port from Dropdown
Chapter 3: Connecting to the Device
The app needs to talk to the breath chamber. Making sure the USB connection is working is the most important step. You must pick the correct port to connect to the device.
To make sure everything is correct, the system asks you to click connect button. User clicks Connect to establish connection to the selected device. The connection attempt begins.
This step is very important. By doing 'click connect button' carefully, you prevent mistakes that could ruin the test results. The app will show you right away if it worked.
 Fig. 31 - Click Connect Button
Now it's time to connected status - active. Connection successful. Status label changes to show 'Connected: [PORT_NAME]'. The device is now communicating.
Why do we do this? In a medical lab, mistakes can cause big problems. The app makes 'connected status - active' simple so you can focus on the patient instead of the computer.
 Fig. 32 - Connected Status - Active
Following the normal steps, we now heartbeat indicator - connected. When connected, the heartbeat icon on the right of the function bar animates to show active communication with the device.
 Fig. 33 - Heartbeat Indicator - Connected
As part of the process, you will need to vitals badges - live data. Real-time sensor data now populates the vitals badges. Temperature, LED voltage, and sensor voltage display actual measured values.
This step is very important. By doing 'vitals badges - live data' carefully, you prevent mistakes that could ruin the test results. The app will show you right away if it worked.
 Fig. 34 - Vitals Badges - Live Data
To keep the data safe before moving forward, you should sensor control button - enabled. When device is connected, the Sensor button becomes enabled. It shows the current sensor state (ON or OFF).
Why do we do this? In a medical lab, mistakes can cause big problems. The app makes 'sensor control button - enabled' simple so you can focus on the patient instead of the computer.
 Fig. 35 - Sensor Control Button - Enabled
Once this is done, you can move on to toggle sensor state. User can click the Sensor button to toggle the sensor on or off. Button state updates to reflect new state.
 Fig. 36 - Toggle Sensor State
After finishing that, the next step is to fan control button - enabled. When device is connected, the Fan button becomes enabled. It shows the current fan state (ON or OFF).
This step is very important. By doing 'fan control button - enabled' carefully, you prevent mistakes that could ruin the test results. The app will show you right away if it worked.
 Fig. 37 - Fan Control Button - Enabled
To make sure everything is correct, the system asks you to toggle fan state. User can click the Fan button to toggle the fan on or off. Button state updates to reflect new state.
Why do we do this? In a medical lab, mistakes can cause big problems. The app makes 'toggle fan state' simple so you can focus on the patient instead of the computer.
 Fig. 38 - Toggle Fan State
Now it's time to temperature threshold - clickable badge. The temperature badge in the top right is clickable. User can click it to open threshold settings dialog.
![]() Fig. 39 - Temperature Threshold - Clickable Badge
Fig. 39 - Temperature Threshold - Clickable Badge
Following the normal steps, we now simulation controls button. In mock mode, a 'Simulation' button appears in the function bar. This opens a window for simulating device errors and states.
This step is very important. By doing 'simulation controls button' carefully, you prevent mistakes that could ruin the test results. The app will show you right away if it worked.
 Fig. 40 - Simulation Controls Button
As part of the process, you will need to simulation window - open. Clicking Simulation opens a separate control window with buttons to trigger mock device errors and conditions.
Why do we do this? In a medical lab, mistakes can cause big problems. The app makes 'simulation window - open' simple so you can focus on the patient instead of the computer.
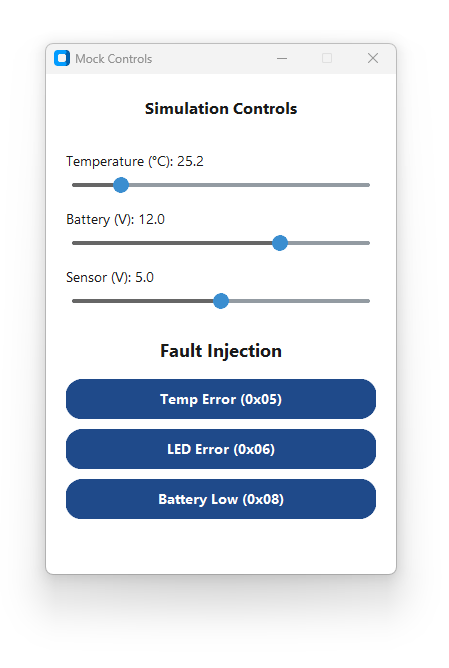 Fig. 41 - Simulation Window - Open
To keep the data safe before moving forward, you should simulation - trigger temp error. In simulation window, there's a button to trigger a temperature error. Clicking this simulates an over-temperature condition.
 Fig. 42 - Simulation - Trigger Temp Error
Once this is done, you can move on to simulation - trigger led error. Button to trigger LED voltage error. Simulates LED circuit failure condition.
This step is very important. By doing 'simulation - trigger led error' carefully, you prevent mistakes that could ruin the test results. The app will show you right away if it worked.
 Fig. 43 - Simulation - Trigger LED Error
After finishing that, the next step is to simulation - trigger battery low. Button to trigger battery low error. Simulates low battery/power supply condition.
Why do we do this? In a medical lab, mistakes can cause big problems. The app makes 'simulation - trigger battery low' simple so you can focus on the patient instead of the computer.
 Fig. 44 - Simulation - Trigger Battery Low
To make sure everything is correct, the system asks you to temperature slider - healthy state (green). Temperature slider set to healthy range (e.g., 25°C). Badge displays in green indicating normal operation.
 Fig. 45 - Temperature Slider - Healthy State (Green)
Now it's time to temperature slider - warning state (orange). Temperature slider moved to warning range (e.g., 50°C, approaching threshold). Badge turns orange to indicate elevated temperature.
This step is very important. By doing 'temperature slider - warning state (orange)' carefully, you prevent mistakes that could ruin the test results. The app will show you right away if it worked.
 Fig. 46 - Temperature Slider - Warning State (Orange)
Following the normal steps, we now temperature slider - critical state (red). Temperature slider moved to critical range (e.g., 65°C, exceeding threshold). Badge turns red to indicate over-temperature condition.
Why do we do this? In a medical lab, mistakes can cause big problems. The app makes 'temperature slider - critical state (red)' simple so you can focus on the patient instead of the computer.
 Fig. 47 - Temperature Slider - Critical State (Red)
As part of the process, you will need to battery slider - healthy state (green). Battery slider set to healthy range (e.g., 12V). Badge displays in green indicating good power supply.
 Fig. 48 - Battery Slider - Healthy State (Green)
To keep the data safe before moving forward, you should battery slider - critical state (red). Battery slider moved to critical range (e.g., 7V, critically low). Badge turns red to indicate critical battery condition.
This step is very important. By doing 'battery slider - critical state (red)' carefully, you prevent mistakes that could ruin the test results. The app will show you right away if it worked.
 Fig. 49 - Battery Slider - Critical State (Red)
Once this is done, you can move on to sensor voltage slider - healthy state (green). Sensor slider set to healthy range (e.g., 5V). Badge displays in green indicating sensor operating normally.
Why do we do this? In a medical lab, mistakes can cause big problems. The app makes 'sensor voltage slider - healthy state (green)' simple so you can focus on the patient instead of the computer.
 Fig. 50 - Sensor Voltage Slider - Healthy State (Green)
After finishing that, the next step is to sensor voltage slider - saturation state (red). Sensor slider moved to saturation range (e.g., 10V, maximum). Badge turns red to indicate sensor saturation or over-range.
 Fig. 51 - Sensor Voltage Slider - Saturation State (Red)
To make sure everything is correct, the system asks you to all three sliders - mixed states. All three sliders set to different states simultaneously: one green (healthy), one orange (warning), one red (critical). Shows how badges update independently.
This step is very important. By doing 'all three sliders - mixed states' carefully, you prevent mistakes that could ruin the test results. The app will show you right away if it worked.
 Fig. 52 - All Three Sliders - Mixed States
Now it's time to navigate to experiment tab. User clicks Experiment tab in the left sidebar. Experiment page loads showing profile management and control options.
Why do we do this? In a medical lab, mistakes can cause big problems. The app makes 'navigate to experiment tab' simple so you can focus on the patient instead of the computer.
 Fig. 53 - Navigate to Experiment Tab
Following the normal steps, we now profile selector - available profiles. The Profile section at the top shows a dropdown with all available profiles. Both default and custom profiles appear in the list.
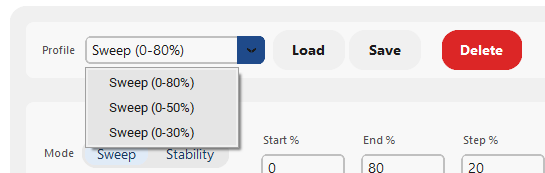 Fig. 54 - Profile Selector - Available Profiles
As part of the process, you will need to click load profile button. User selects a profile from dropdown and clicks Load button. The selected profile's settings are loaded into the experiment controls.
This step is very important. By doing 'click load profile button' carefully, you prevent mistakes that could ruin the test results. The app will show you right away if it worked.
 Fig. 55 - Click Load Profile Button
To keep the data safe before moving forward, you should profile settings applied. After loading, all experiment parameters are set to the profile's values. The UI reflects the loaded configuration.
Why do we do this? In a medical lab, mistakes can cause big problems. The app makes 'profile settings applied' simple so you can focus on the patient instead of the computer.
 Fig. 56 - Profile Settings Applied
Once this is done, you can move on to click save profile button. User modifies parameters and clicks Save to create/update a profile. Input dialog appears asking for profile name.
 Fig. 57 - Click Save Profile Button
After finishing that, the next step is to enter profile name - dialog. User types desired profile name into the dialog input field.
This step is very important. By doing 'enter profile name - dialog' carefully, you prevent mistakes that could ruin the test results. The app will show you right away if it worked.
 Fig. 58 - Enter Profile Name - Dialog
To make sure everything is correct, the system asks you to profile saved - success. After confirming the name, profile is saved. New profile appears in the dropdown list.
Why do we do this? In a medical lab, mistakes can cause big problems. The app makes 'profile saved - success' simple so you can focus on the patient instead of the computer.
 Fig. 59 - Profile Saved - Success
Now it's time to click delete profile button. User selects a profile and clicks Delete button. Confirmation dialog appears.
 Fig. 60 - Click Delete Profile Button
Following the normal steps, we now delete confirmation - cannot delete default. If trying to delete a default profile, system prevents deletion and shows error message.
This step is very important. By doing 'delete confirmation - cannot delete default' carefully, you prevent mistakes that could ruin the test results. The app will show you right away if it worked.
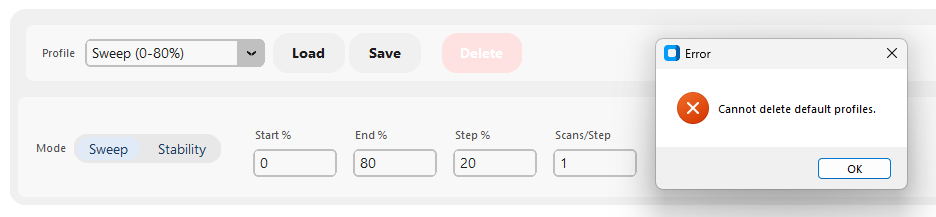 Fig. 61 - Delete Confirmation - Cannot Delete Default
As part of the process, you will need to delete confirmation - custom profile. For custom profiles, confirmation is requested. User confirms deletion.
Why do we do this? In a medical lab, mistakes can cause big problems. The app makes 'delete confirmation - custom profile' simple so you can focus on the patient instead of the computer.
 Fig. 62 - Delete Confirmation - Custom Profile
Chapter 4: Running a Patient Test
Everything is set up and ready. It is time to test the patient. When the patient breathes into the chamber, you will start collecting the data.
To keep the data safe before moving forward, you should mode selector - sweep vs stability. At the top of experiment controls, a segmented button allows choosing between Sweep and Stability modes.
 Fig. 63 - Mode Selector - Sweep vs Stability
Once this is done, you can move on to select sweep mode. Click Sweep option in mode selector. Sweep-specific parameters appear (Start %, End %, Step %, Scans/Step).
This step is very important. By doing 'select sweep mode' carefully, you prevent mistakes that could ruin the test results. The app will show you right away if it worked.
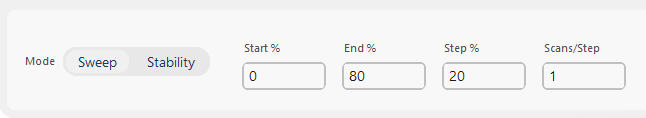 Fig. 64 - Select Sweep Mode
After finishing that, the next step is to sweep mode parameters. Sweep mode shows four parameter input fields for configuring the parameter sweep range and resolution.
Why do we do this? In a medical lab, mistakes can cause big problems. The app makes 'sweep mode parameters' simple so you can focus on the patient instead of the computer.
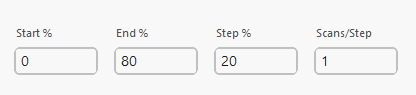 Fig. 65 - Sweep Mode Parameters
To make sure everything is correct, the system asks you to select stability mode. Click Stability option in mode selector. Stability-specific parameters appear.
 Fig. 66 - Select Stability Mode
Now it's time to stability mode parameters. Stability mode shows different parameters like duration and scan interval for stability testing.
This step is very important. By doing 'stability mode parameters' carefully, you prevent mistakes that could ruin the test results. The app will show you right away if it worked.
 Fig. 67 - Stability Mode Parameters
Following the normal steps, we now start experiment - ready. Start button is visible and ready. Button text shows 'Start Sweep' or 'Start Stability' depending on selected mode.
Why do we do this? In a medical lab, mistakes can cause big problems. The app makes 'start experiment - ready' simple so you can focus on the patient instead of the computer.
 Fig. 68 - Start Experiment - Ready
As part of the process, you will need to click start button. User clicks Start to begin experiment. Data collection begins immediately.
 Fig. 69 - Click Start Button
To keep the data safe before moving forward, you should experiment running - initial. Experiment starts. Recording indicator appears. First data points begin collecting.
This step is very important. By doing 'experiment running - initial' carefully, you prevent mistakes that could ruin the test results. The app will show you right away if it worked.
 Fig. 70 - Experiment Running - Initial
Once this is done, you can move on to data collection - progress. During experiment execution. Data points accumulate and are displayed in real-time.
Why do we do this? In a medical lab, mistakes can cause big problems. The app makes 'data collection - progress' simple so you can focus on the patient instead of the computer.
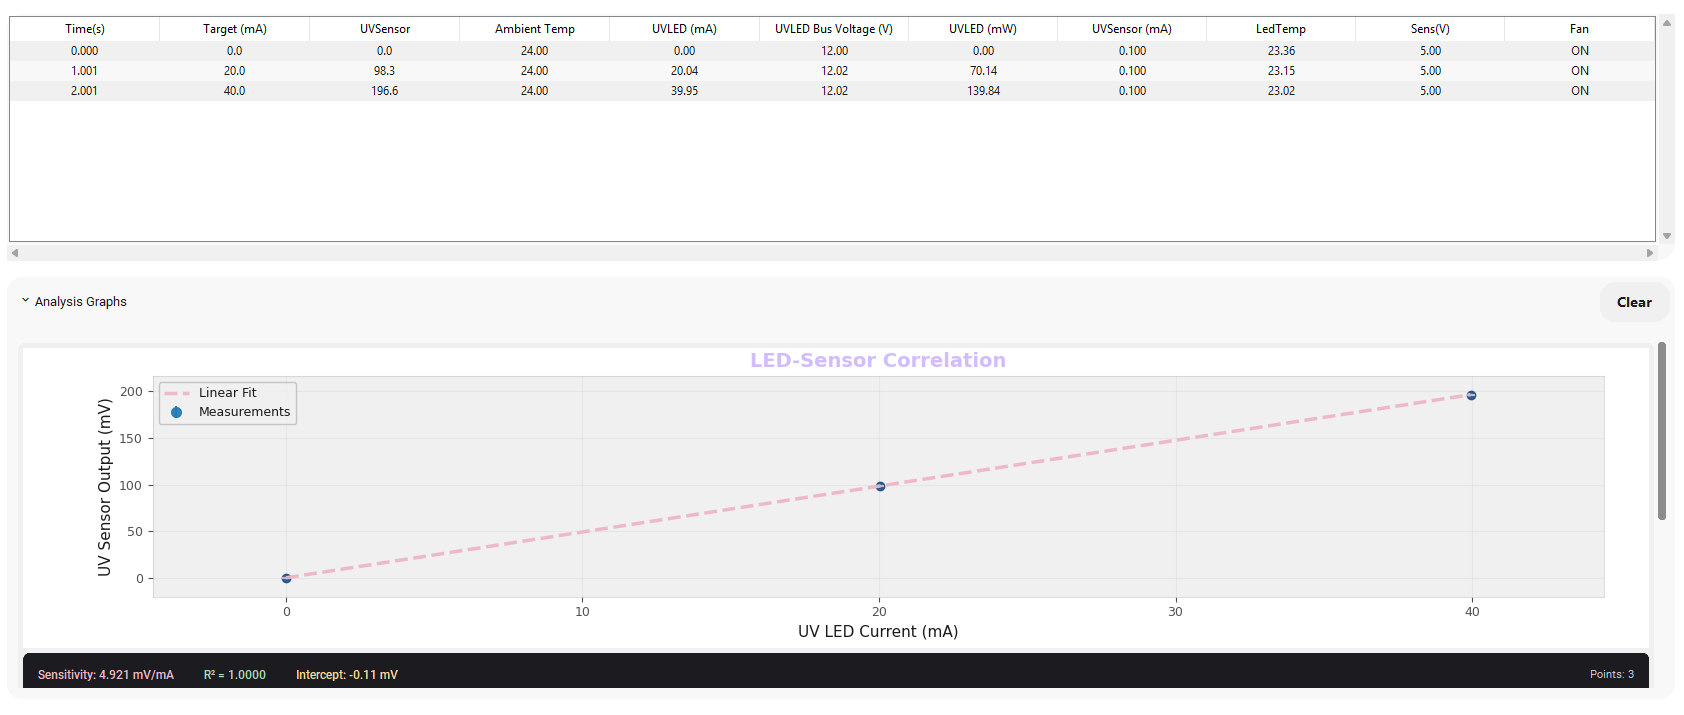 Fig. 71 - Data Collection - Progress
After finishing that, the next step is to experiment complete. Experiment finishes. Recording stops. Final data displayed.
 Fig. 72 - Experiment Complete
To make sure everything is correct, the system asks you to graph display - live data. Large correlation graph area shows real-time plotted data with multiple lines (one per parameter).
This step is very important. By doing 'graph display - live data' carefully, you prevent mistakes that could ruin the test results. The app will show you right away if it worked.
 Fig. 73 - Graph Display - Live Data
Now it's time to graph legend. Legend on graph shows which line represents which parameter.
Why do we do this? In a medical lab, mistakes can cause big problems. The app makes 'graph legend' simple so you can focus on the patient instead of the computer.
 Fig. 74 - Graph Legend
Following the normal steps, we now graph toggle button. Button labeled 'Graph Toggle' or 'Clear' lets you toggle graph view or clear data.
 Fig. 75 - Graph Toggle Button
As part of the process, you will need to click clear graph. User clicks Clear button to reset graph and data table for new experiment.
This step is very important. By doing 'click clear graph' carefully, you prevent mistakes that could ruin the test results. The app will show you right away if it worked.
 Fig. 76 - Click Clear Graph
To keep the data safe before moving forward, you should label entry field. Below the graph/table is a text entry field for adding notes or labels to mark important data points.
Why do we do this? In a medical lab, mistakes can cause big problems. The app makes 'label entry field' simple so you can focus on the patient instead of the computer.
 Fig. 77 - Label Entry Field
Once this is done, you can move on to click save label button. User clicks Save Label to add the label as a marker in the data stream.
 Fig. 78 - Click Save Label Button
After finishing that, the next step is to label marker added to graph. The label is recorded and may be visually marked on the graph at the current data point.
This step is very important. By doing 'label marker added to graph' carefully, you prevent mistakes that could ruin the test results. The app will show you right away if it worked.
 Fig. 79 - Label Marker Added to Graph
To make sure everything is correct, the system asks you to export csv button. After experiment, there's an Export CSV button to save the collected data as CSV file.
Why do we do this? In a medical lab, mistakes can cause big problems. The app makes 'export csv button' simple so you can focus on the patient instead of the computer.
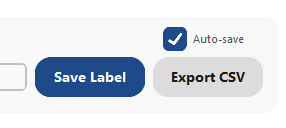 Fig. 80 - Export CSV Button
Now it's time to click export csv. User clicks Export button. File save dialog appears or file downloads directly.
 Fig. 81 - Click Export CSV
Following the normal steps, we now data exported to csv. File is saved successfully. Contains all experiment data and labels.
This step is very important. By doing 'data exported to csv' carefully, you prevent mistakes that could ruin the test results. The app will show you right away if it worked.
 Fig. 82 - Data Exported to CSV
As part of the process, you will need to navigate to diagnostics tab. User clicks Diagnostics tab. System test page opens with control buttons and test result cards.
Why do we do this? In a medical lab, mistakes can cause big problems. The app makes 'navigate to diagnostics tab' simple so you can focus on the patient instead of the computer.
 Fig. 83 - Navigate to Diagnostics Tab
To keep the data safe before moving forward, you should port selection - diagnostics. Port dropdown at top of diagnostics view. User can select which port to run diagnostics on.
 Fig. 84 - Port Selection - Diagnostics
Once this is done, you can move on to click refresh ports - diagnostics. Refresh button to update available ports in diagnostics view.
This step is very important. By doing 'click refresh ports - diagnostics' carefully, you prevent mistakes that could ruin the test results. The app will show you right away if it worked.
 Fig. 85 - Click Refresh Ports - Diagnostics
After finishing that, the next step is to click quick tests button. User clicks Quick Tests button to run a quick diagnostic suite.
Why do we do this? In a medical lab, mistakes can cause big problems. The app makes 'click quick tests button' simple so you can focus on the patient instead of the computer.
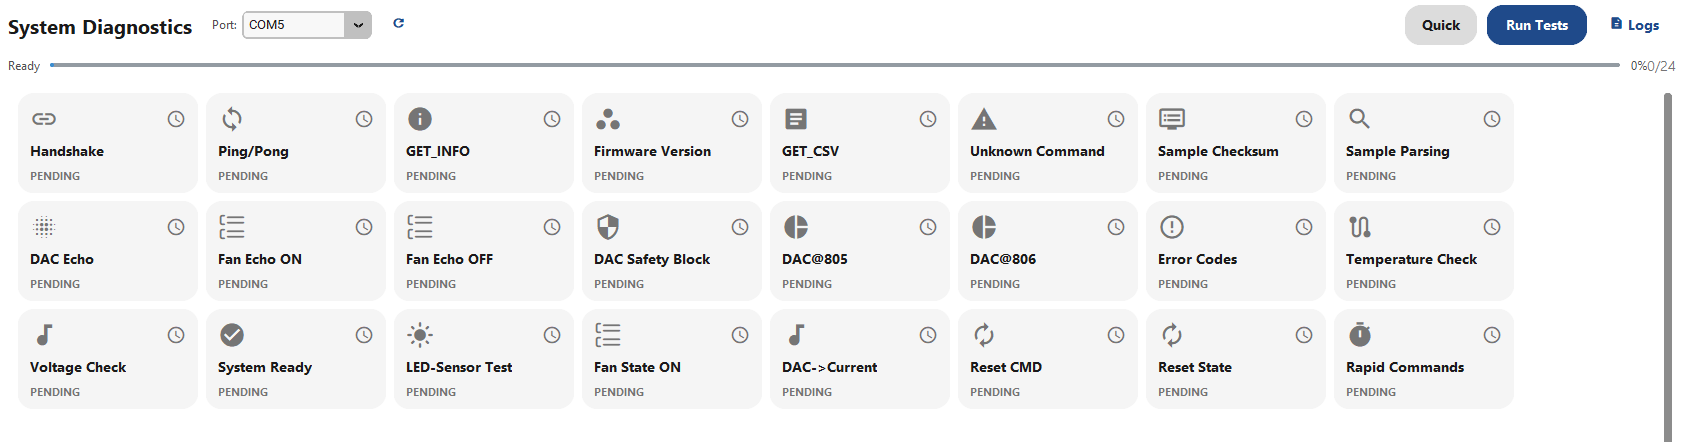 Fig. 86 - Click Quick Tests Button
To make sure everything is correct, the system asks you to quick tests running - progress. Progress bar shows test progress. Status label indicates 'Running...'
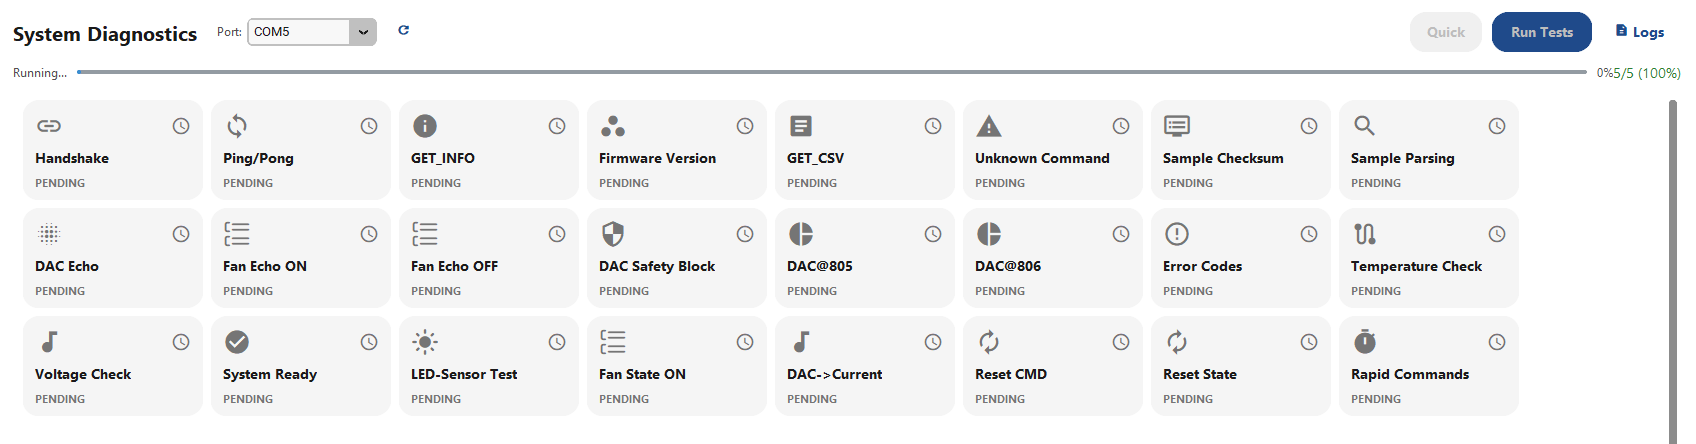 Fig. 87 - Quick Tests Running - Progress
Now it's time to test cards updating - quick tests. During tests, test result cards update with pass/fail states in real-time.
This step is very important. By doing 'test cards updating - quick tests' carefully, you prevent mistakes that could ruin the test results. The app will show you right away if it worked.
 Fig. 88 - Test Cards Updating - Quick Tests
Following the normal steps, we now quick tests complete. Quick test suite finishes. Results displayed in cards.
Why do we do this? In a medical lab, mistakes can cause big problems. The app makes 'quick tests complete' simple so you can focus on the patient instead of the computer.
 Fig. 89 - Quick Tests Complete
As part of the process, you will need to click run tests button. User clicks Run Tests button to execute the complete diagnostic suite (all 24 tests).
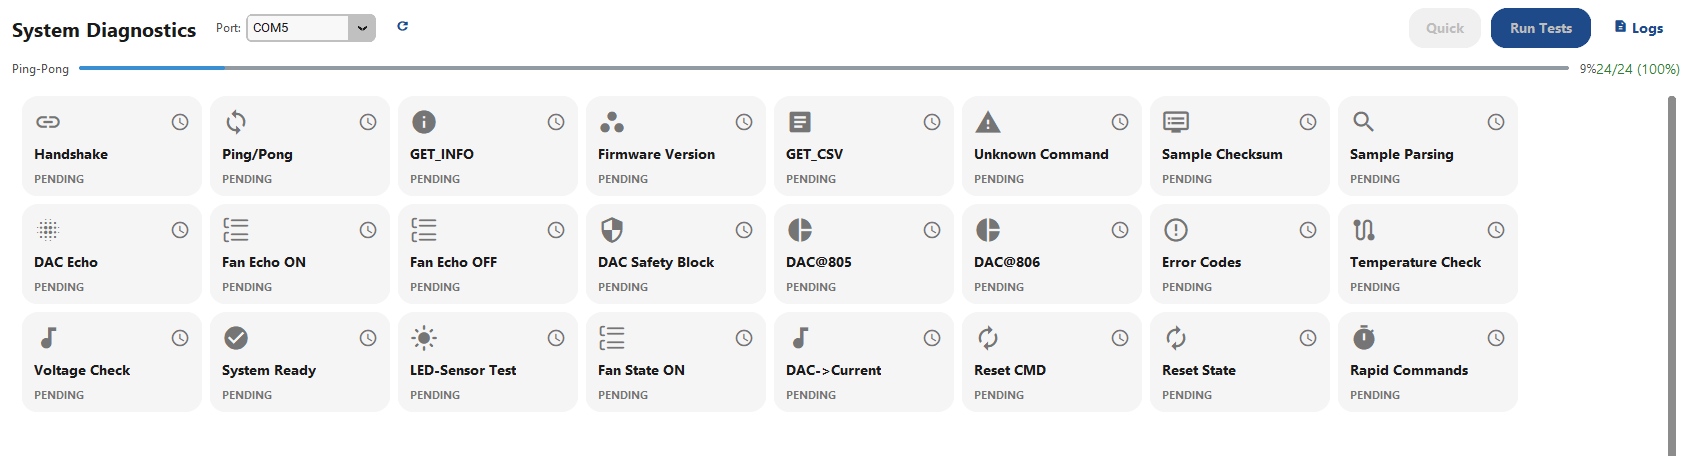 Fig. 90 - Click Run Tests Button
To keep the data safe before moving forward, you should full tests running. Tests execute with progress indication. Status updates in real-time.
This step is very important. By doing 'full tests running' carefully, you prevent mistakes that could ruin the test results. The app will show you right away if it worked.
 Fig. 91 - Full Tests Running
Once this is done, you can move on to full tests complete. All tests finished. Complete results shown.
Why do we do this? In a medical lab, mistakes can cause big problems. The app makes 'full tests complete' simple so you can focus on the patient instead of the computer.
 Fig. 92 - Full Tests Complete
After finishing that, the next step is to test card - example tests. Individual test result cards show status for tests like Handshake, Ping/Pong, GET_INFO, etc.
 Fig. 93 - Test Card - Example Tests
To make sure everything is correct, the system asks you to test card - passed state. Test card showing successful test (PASS state).
This step is very important. By doing 'test card - passed state' carefully, you prevent mistakes that could ruin the test results. The app will show you right away if it worked.
 Fig. 94 - Test Card - Passed State
Now it's time to test card - failed state. Test card showing failed test (FAIL state).
Why do we do this? In a medical lab, mistakes can cause big problems. The app makes 'test card - failed state' simple so you can focus on the patient instead of the computer.
 Fig. 95 - Test Card - Failed State
Following the normal steps, we now test card - pending state. Test card before test has run (PENDING state).
 Fig. 96 - Test Card - Pending State
As part of the process, you will need to click logs button. User clicks Logs button to toggle log display. Shows device communication logs.
This step is very important. By doing 'click logs button' carefully, you prevent mistakes that could ruin the test results. The app will show you right away if it worked.
 Fig. 97 - Click Logs Button
To keep the data safe before moving forward, you should logs sidebar - display. Logs sidebar expands showing device communication messages in chronological order.
Why do we do this? In a medical lab, mistakes can cause big problems. The app makes 'logs sidebar - display' simple so you can focus on the patient instead of the computer.
 Fig. 98 - Logs Sidebar - Display
Once this is done, you can move on to close logs sidebar. User clicks to close logs sidebar, returning to full test card grid.
 Fig. 99 - Close Logs Sidebar
Chapter 5: Saving and Viewing Past Tests
After a test, it is very important to save the data. The data must be kept safe so you can look at it later or export it for review. Here is how you use the History tab to manage your files.
After finishing that, the next step is to navigate to history tab. User clicks History tab. List of past experiments and saved data displayed.
This step is very important. By doing 'navigate to history tab' carefully, you prevent mistakes that could ruin the test results. The app will show you right away if it worked.
 Fig. 100 - Navigate to History Tab
To make sure everything is correct, the system asks you to history experiments list. Full list of saved experiments from past sessions.
Why do we do this? In a medical lab, mistakes can cause big problems. The app makes 'history experiments list' simple so you can focus on the patient instead of the computer.
 Fig. 101 - History Experiments List
Now it's time to click load - history item. User clicks Load button on a history item to load that experiment's data.
 Fig. 102 - Click Load - History Item
Following the normal steps, we now experiment data loaded. After clicking Load, data returns to Experiment tab and is displayed.
This step is very important. By doing 'experiment data loaded' carefully, you prevent mistakes that could ruin the test results. The app will show you right away if it worked.
 Fig. 103 - Experiment Data Loaded
As part of the process, you will need to add to bucket - history item. User clicks Add to Bucket button to organize item into a collection.
Why do we do this? In a medical lab, mistakes can cause big problems. The app makes 'add to bucket - history item' simple so you can focus on the patient instead of the computer.
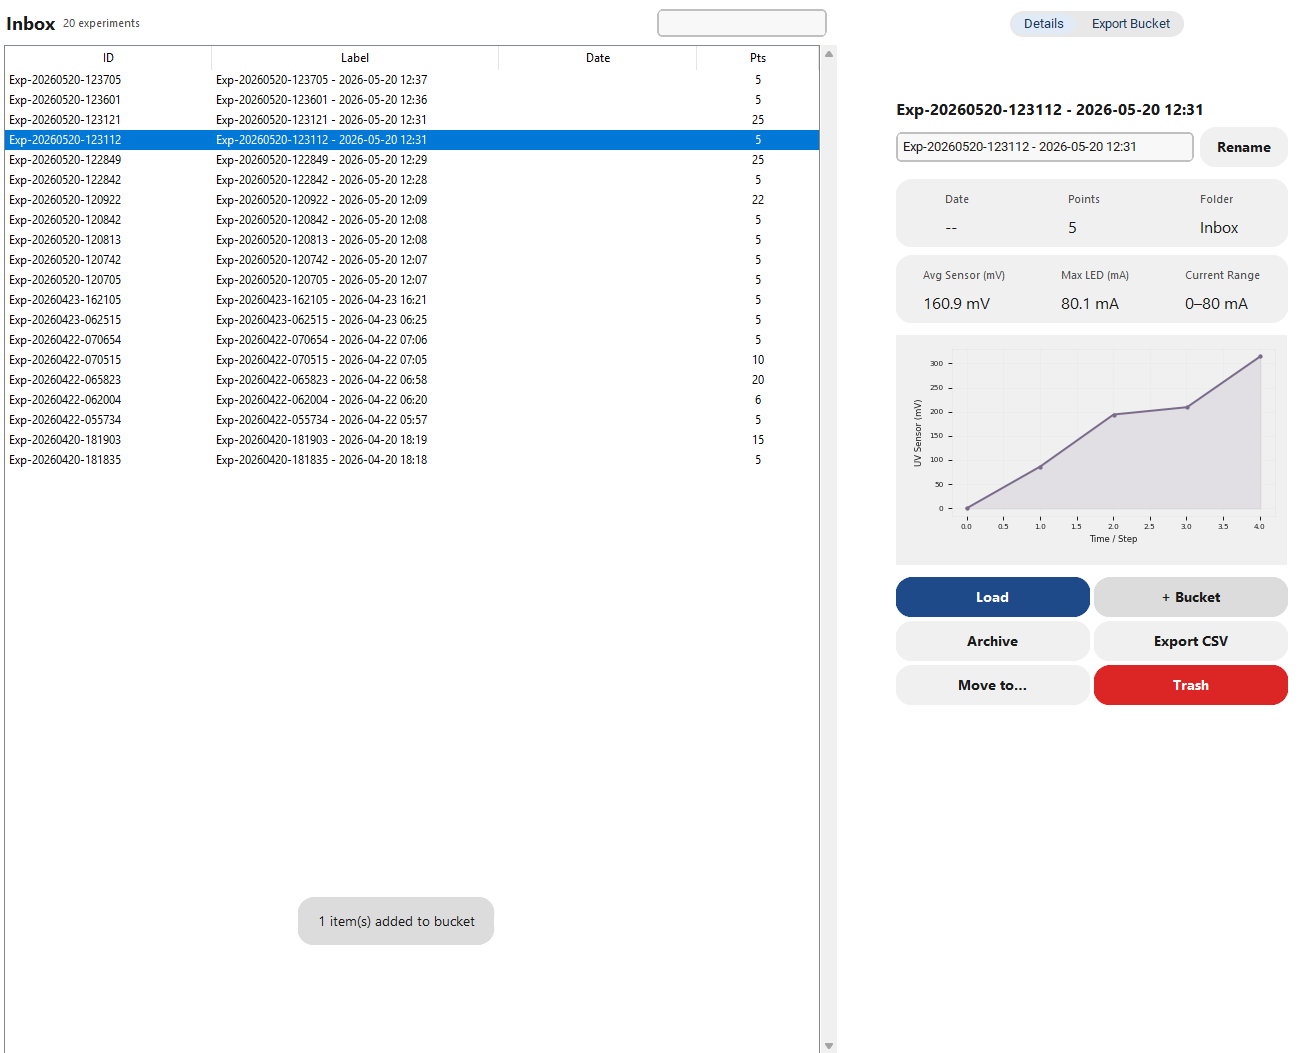 Fig. 104 - Add to Bucket - History Item
To keep the data safe before moving forward, you should archive - history item. Click Archive button to move item out of main history.
 Fig. 105 - Archive - History Item
Once this is done, you can move on to export single item. Click Export CSV on individual history item to download just that experiment.
This step is very important. By doing 'export single item' carefully, you prevent mistakes that could ruin the test results. The app will show you right away if it worked.
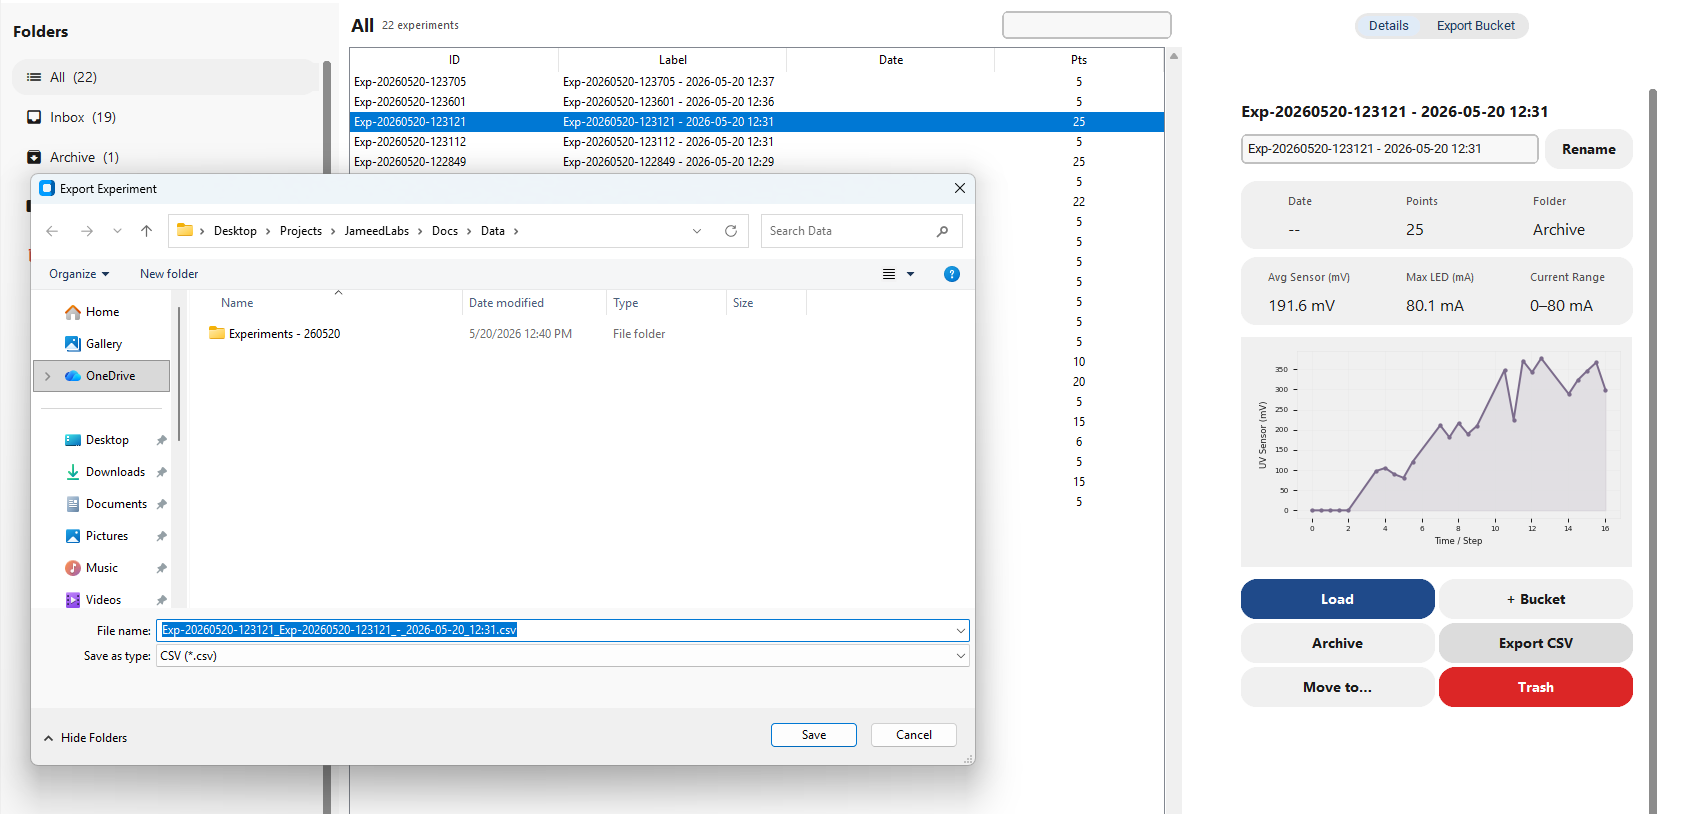 Fig. 106 - Export Single Item
After finishing that, the next step is to move to trash. Click Trash/Delete button to move item to trash.
Why do we do this? In a medical lab, mistakes can cause big problems. The app makes 'move to trash' simple so you can focus on the patient instead of the computer.
 Fig. 107 - Move to Trash
To make sure everything is correct, the system asks you to trash section. View showing deleted items in trash.
 Fig. 108 - Trash Section
Now it's time to trash - restore item. Click Restore to recover a trashed item back to history.
This step is very important. By doing 'trash - restore item' carefully, you prevent mistakes that could ruin the test results. The app will show you right away if it worked.
 Fig. 109 - Trash - Restore Item
Following the normal steps, we now trash - delete forever. Click Delete Forever to permanently remove item (cannot be undone).
Why do we do this? In a medical lab, mistakes can cause big problems. The app makes 'trash - delete forever' simple so you can focus on the patient instead of the computer.
 Fig. 110 - Trash - Delete Forever
As part of the process, you will need to delete confirmation. Confirmation dialog before permanent deletion.
 Fig. 111 - Delete Confirmation
To keep the data safe before moving forward, you should empty trash button. Button to clear all items from trash at once.
This step is very important. By doing 'empty trash button' carefully, you prevent mistakes that could ruin the test results. The app will show you right away if it worked.
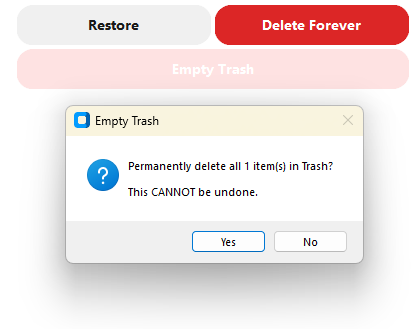 Fig. 112 - Empty Trash Button
Once this is done, you can move on to buckets view. View showing collections/buckets of organized experiments.
Why do we do this? In a medical lab, mistakes can cause big problems. The app makes 'buckets view' simple so you can focus on the patient instead of the computer.
 Fig. 113 - Buckets View
After finishing that, the next step is to export bucket - all items. Export entire bucket. The app generates both a combined CSV and individual CSVs for each experiment (N+1 files).
 Fig. 114 - Export Bucket - All Items
To make sure everything is correct, the system asks you to create backup - zip. Click Backup ZIP button to create complete data backup.
This step is very important. By doing 'create backup - zip' carefully, you prevent mistakes that could ruin the test results. The app will show you right away if it worked.
 Fig. 115 - Create Backup - ZIP
Now it's time to backup file created. Backup ZIP file created containing all experiment data.
Why do we do this? In a medical lab, mistakes can cause big problems. The app makes 'backup file created' simple so you can focus on the patient instead of the computer.
 Fig. 116 - Backup File Created
Following the normal steps, we now import backup button. Click Import Backup to restore data from a backup file.
 Fig. 117 - Import Backup Button
As part of the process, you will need to restore from backup. Backup data imported and restored to app.
This step is very important. By doing 'restore from backup' carefully, you prevent mistakes that could ruin the test results. The app will show you right away if it worked.
 Fig. 118 - Restore from Backup
To keep the data safe before moving forward, you should navigate to settings tab. User clicks Settings tab. Configuration options appear.
Why do we do this? In a medical lab, mistakes can cause big problems. The app makes 'navigate to settings tab' simple so you can focus on the patient instead of the computer.
 Fig. 119 - Navigate to Settings Tab
Once this is done, you can move on to temperature threshold setting. Input field for maximum temperature threshold. Default value shown.
 Fig. 120 - Temperature Threshold Setting
After finishing that, the next step is to led voltage threshold setting. Input field for LED voltage threshold.
This step is very important. By doing 'led voltage threshold setting' carefully, you prevent mistakes that could ruin the test results. The app will show you right away if it worked.
 Fig. 121 - LED Voltage Threshold Setting
To make sure everything is correct, the system asks you to sensor voltage threshold setting. Input field for sensor voltage threshold.
Why do we do this? In a medical lab, mistakes can cause big problems. The app makes 'sensor voltage threshold setting' simple so you can focus on the patient instead of the computer.
 Fig. 122 - Sensor Voltage Threshold Setting
Now it's time to click save settings button. User clicks Save to persist the new settings.
 Fig. 123 - Click Save Settings Button
Following the normal steps, we now settings saved - confirmation. Confirmation message shows settings were saved successfully.
This step is very important. By doing 'settings saved - confirmation' carefully, you prevent mistakes that could ruin the test results. The app will show you right away if it worked.
 Fig. 124 - Settings Saved - Confirmation
As part of the process, you will need to reset to defaults - confirmation. Click Reset Defaults button. A confirmation dialog appears to warn about losing custom settings.
Why do we do this? In a medical lab, mistakes can cause big problems. The app makes 'reset to defaults - confirmation' simple so you can focus on the patient instead of the computer.
 Fig. 125 - Reset to Defaults - Confirmation
To keep the data safe before moving forward, you should settings reset to defaults. All settings restored to factory defaults.
 Fig. 126 - Settings Reset to Defaults
Once this is done, you can move on to navigate to help tab. User clicks Help tab. Help documentation and FAQs displayed.
This step is very important. By doing 'navigate to help tab' carefully, you prevent mistakes that could ruin the test results. The app will show you right away if it worked.
 Fig. 127 - Navigate to Help Tab
After finishing that, the next step is to about page - version control. This page is intended for version control and provides a view of the currently installed application version and system metadata.
Why do we do this? In a medical lab, mistakes can cause big problems. The app makes 'about page - version control' simple so you can focus on the patient instead of the computer.
 Fig. 128 - About Page - Version Control
To make sure everything is correct, the system asks you to profile name dialog. Dialog for entering new profile name when saving profile.
 Fig. 129 - Profile Name Dialog
Now it's time to folder name dialog. Dialog for entering bucket/folder name when creating new collection.
This step is very important. By doing 'folder name dialog' carefully, you prevent mistakes that could ruin the test results. The app will show you right away if it worked.
 Fig. 130 - Folder Name Dialog
Following the normal steps, we now delete profile confirmation. Dialog confirming deletion of selected profile.
Why do we do this? In a medical lab, mistakes can cause big problems. The app makes 'delete profile confirmation' simple so you can focus on the patient instead of the computer.
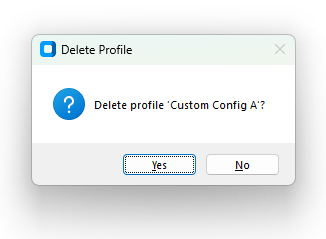 Fig. 131 - Delete Profile Confirmation
As part of the process, you will need to delete forever confirmation. Dialog confirming permanent deletion of trashed item.
 Fig. 132 - Delete Forever Confirmation
To keep the data safe before moving forward, you should reset settings confirmation. Dialog warning about reset to defaults.
This step is very important. By doing 'reset settings confirmation' carefully, you prevent mistakes that could ruin the test results. The app will show you right away if it worked.
 Fig. 133 - Reset Settings Confirmation
Once this is done, you can move on to disconnect required dialog. Dialog saying diagnostics require disconnecting from device.
Why do we do this? In a medical lab, mistakes can cause big problems. The app makes 'disconnect required dialog' simple so you can focus on the patient instead of the computer.
 Fig. 134 - Disconnect Required Dialog
After finishing that, the next step is to error - no port selected. Error message when trying to connect with no port selected.
 Fig. 135 - Error - No Port Selected
To make sure everything is correct, the system asks you to error - invalid parameters. Error when entering invalid parameter values.
This step is very important. By doing 'error - invalid parameters' carefully, you prevent mistakes that could ruin the test results. The app will show you right away if it worked.
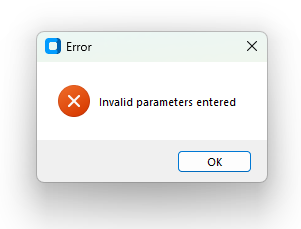 Fig. 136 - Error - Invalid Parameters
Now it's time to error - cannot delete default profile. Error when attempting to delete system default profile.
Why do we do this? In a medical lab, mistakes can cause big problems. The app makes 'error - cannot delete default profile' simple so you can focus on the patient instead of the computer.
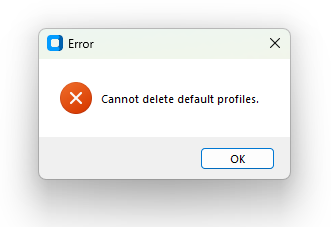 Fig. 137 - Error - Cannot Delete Default Profile
Following the normal steps, we now success - profile saved. Notification showing profile was saved successfully.
 Fig. 138 - Success - Profile Saved
As part of the process, you will need to success - data exported. Notification showing data export completed.
This step is very important. By doing 'success - data exported' carefully, you prevent mistakes that could ruin the test results. The app will show you right away if it worked.
 Fig. 139 - Success - Data Exported
To keep the data safe before moving forward, you should success - settings saved. Notification showing settings were saved.
Why do we do this? In a medical lab, mistakes can cause big problems. The app makes 'success - settings saved' simple so you can focus on the patient instead of the computer.
 Fig. 140 - Success - Settings Saved
Once this is done, you can move on to export csv - file dialog. File save dialog when exporting CSV data.
 Fig. 141 - Export CSV - File Dialog
After finishing that, the next step is to import backup - file dialog. File open dialog when importing backup ZIP.
This step is very important. By doing 'import backup - file dialog' carefully, you prevent mistakes that could ruin the test results. The app will show you right away if it worked.
 Fig. 142 - Import Backup - File Dialog